
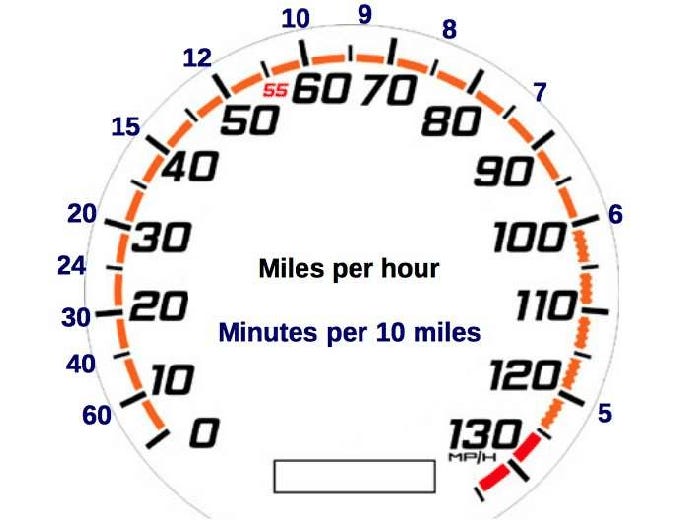
The Paceometer:Why going faster doesn’t mean getting there more efficiently
Two things will contribute greatly to a comfortable retirement. One is having more money and the other is not having less money.

There’s a concept that I keep coming back to in investing known as volatility drag. I frequently see comments by Financial advisers essentially to the effect that equities grew at 10%pa for the last 100 years, bonds bearly beat inflation so therefore bonds are just a waste of time and you should put all your money in equities. Some argue that to advise otherwise is being irresponsible.
Now, if you never touch your portfolio for 100 years, then, yes that makes sense.
But for almost everyone else, who, living in the real world, might want to occasionally use their investments to buy things, then it’s probably the wrong approach.
The maths isn’t necessarily intuitive so I’ll use some reference examples starting with the observation about driving known as the “Paceometer”.
Let me take you through it.
The Driving Problem
Imagine a 100-mile journey.
Most people assume that going faster saves time in a roughly proportional way. Push your speed up, get there sooner.
Except it’s not that simple and it’s not even close to a linear relationship.
|Speed |Journey Time |
|------|------------------|
|50 mph|2 hours 00 minutes|
|60 mph|1 hour 40 minutes |
|70 mph|1 hour 26 minutes |
|80 mph|1 hour 15 minutes |
Let’s focus on the marginal gains, what each extra 10 mph actually buys you in time saved over the journey:
- 50 → 60 mph: saves 20 minutes
- 60 → 70 mph: saves 14 minutes
- 70 → 80 mph: saves 11 minutes
Each additional burst of speed delivers a diminishing marginal return.
The mathematics is:
Time = Distance ÷ Speed.
As your speed increases, the curve flattens and the incremental benefit shrinks.
And, all the while, the time saved benefits are shrinking, the costs are going the other way.
Your risk of being involved in an accident rises sharply as breaking distances increase dramatically.
Your fuel consumption climbs disproportionately (thanks to air resistance, which increases with the square of speed and more on that in a moment).
You are paying more and risking more for less and less actual gain.
That is the Paceometer effect.
Physics: it’s a real drag
In physics, air resistance, or drag, doesn’t increase with your speed, it increases with the square of your speed.
Double your speed, and drag quadruples. So if you drive at 80 mph instead of 40 mph then your car is fighting four times the air resistance.
This is why fuel efficiency falls off a cliff at motorway speeds, the engine isn’t just working a little harder, it’s burning exponentially more energy just to sustain the pace.
Keep the word Drag in mind because investments have their own version of it.
The Investment Equivalent: Volatility Drag
Here’s a simple illustration.
Your portfolio falls 50%. To get back to where you started, you don’t need a 50% gain, you need 100%.
Let’s work through the maths:
- Start with €100
- Fall 50% → you’re at €50
- Rise 50% → you’re at €75
- You needed +100% (€50 to get back to your original €100
This is volatility drag. The bigger the swings, the more the mathematics erode your actual compound return even when the average looks fine.
For example:
- Year 1: +30%
- Year 2: −30%
- Average return: 0%
That’s not too bad surely? But what is your account actually worth?
€100 → €130 → €91
You averaged zero but lost 9%.
That’s the mathematics of volatility.
The Recovery Table
|Loss|Recovery Required|
|----|-----------------|
|−10%|+11% |
|−20%|+25% |
|−30%|+43% |
|−40%|+67% |
|−50%|+100% |
|−75%|+300% |
The curve doesn’t just steepen, it accelerates away from you.
A 10% loss is an inconvenience.
But a 50% loss is a potentially life changing event.
If market returns were normally distributed, you would expect a 40% drop around 2.5% of the time or about one year in 40.
So thinking in terms of these orders of magnitude is completely appropriate especially since market returns are not normally distributed and have “fat tails” in other words , large losses occur more frequently than we would predict.
And, we know from studying the behaviour of real investors that many never get back because they give up and sell.
Which brings me to the hardest part of this.
The Crash That Ends the Game
In driving, if you go fast enough and something goes wrong, the journey ends. It’s not delayed, it’s ended.
You don’t get a second attempt at that particular trip.
Investing has an equivalent.
A loss so deep or, at least, a loss that triggers panic selling at the bottom, is the financial equivalent of a car crash. It removes you from the game entirely.
If you sell out and go to cash you destroy your future compounding engine and turn a temporary market decline into a permanent loss of capital.
This is why experienced financial planners talk obsessively about portfolio survivability and diversification, because you cannot compound from zero.
The first job of any serious investment strategy is not to generate the highest possible return. It’s to stay in the game long enough for compounding to do its job.
The Unified Insight
Step back and look at what both of these. the Paceometer and volatility drag story are actually telling us because they are saying the same thing.
In driving: more speed delivers diminishing time savings while costs and risks grow non-linearly.
In investing: more volatility delivers diminishing compounding while the mathematics of recovery grows brutally steep.
The pattern is consistent, adding more (speed or risk) doesn’t result in a linear risk/return payoff.
What we really want as passengers or investors is the most efficient progress combined with survivability.
What does this mean?
The Paceometer isn’t an argument for driving at 20.
Just as for investors it’s not an argument for parking all your money in cash on the grounds of downside risk management.
Risk-taking during the growth phase when you are adding to your portfolio and have time to recover from a decline makes sense.
But for late-stage investors about to enter or just in retirement then continuing to plow ahead in 6th gear in the fast lane is where the curve flattens and the drag kicks in and the crash risk compounds.
Two things will contribute greatly to a comfortable retirement. One is having more money and the other is not having less money.
The people who finish well in long-term investing aren’t always the ones who have swung hardest. They’re the ones who understood this curve, managed the drag, and kept themselves in the journey long enough for the mathematics to work in their favour.
Long journeys, be it across a country, or across a lifetime of investing are rarely won by whoever travelled fastest.
They’re won by whoever actually arrived.